Generation Mining Provides Update on 2024 Summer Exploration Program
This press release features multimedia. View the full release here: https://www.businesswire.com/news/home/20240726949339/en/
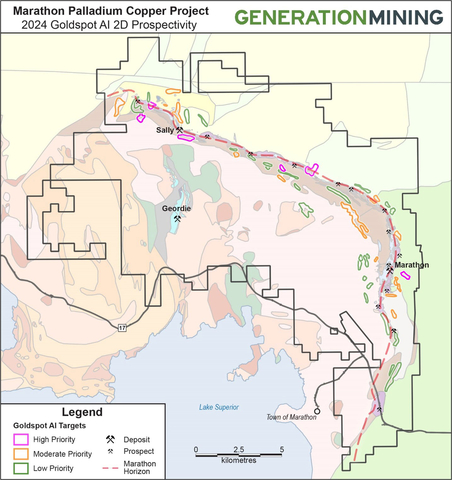
Figure 1: Map showing the 46 priority exploration targets identified by Goldspot during the 2024 2D Prospectivity analysis. Red dashed line shows the approximate location of the main Marathon Horizon along the outer limb of the
Goldspot 2D Prospectivity Analysis
Between March and
The diamond drilling portion of the 2024 exploration program has also been completed on the Marathon Property, including the Sally Deposit, Four Dams Prospect and Biiwobik Prospect.
Sally Deposit
Drilling at Sally consisted of a single drillhole targeting a large Magnetotelluric (MT) anomaly down dip from the Sally Deposit.
Drilling was completed to 954 m and encountered a wide interval of mineralization approximately 275m outside the currently defined deposit, highlighting the exceptional expansion potential at Sally. Highlights from this zone include 48 metres at 1.52 g/t PdEq (0.74 g/t Pd, 0.18% Cu, 0.46 g/t Pt, 0.13 g/t Au and 0.94 g/t Ag) including 6.0 metres at 3.42 g/t PdEq (1.91 g/t Pd, 0.03% Cu, 0.46 g/t Pt, 0.39 g/t Au and 0.23 g/t Ag). Results from this hole (SL-24-079) can be found in Table 1 below.
Table 1: 2024 Sally Drilling Location and Orientation
|
HoleID |
Total Depth |
CollarAzi |
Colar Dip |
Easting UTM NAD83 |
Northing UTM NAD83 |
Elevation |
|
SL-24-079 |
954 |
348 |
-61 |
537677 |
5412219 |
531 |
Table 2: 2024 Sally Drilling Results
|
HoleID |
From |
To |
Length1 |
Cu (%) |
Pd (g/t) |
Pt (g/t) |
Au (g/t) |
Ag (g/t) |
CuEq (%)2 |
PdEq (g/t)3 |
|
SL-24-079 |
730 |
754 |
24 |
0.29 |
0.02 |
0.02 |
0.02 |
0.88 |
0.35 |
0.50 |
|
and |
764 |
768 |
4 |
0.08 |
0.81 |
0.92 |
0.02 |
0.30 |
1.11 |
1.63 |
|
and |
798 |
846 |
48 |
0.18 |
0.74 |
0.46 |
0.13 |
0.94 |
1.04 |
1.52 |
|
including |
806 |
812 |
6 |
0.03 |
1.91 |
1.35 |
0.39 |
0.23 |
2.34 |
3.42 |
1. All lengths are in metres. Interval lengths of interceptions are assumed to be approximate to true width.
2. The Copper Equivalent (“CuEq”) calculation expressed in % is calculated as the sum of the theoretical in situ value of the constituent metals (Au + Pt + Pd + Cu + Ag) in one tonne sampled divided by the value of one percent of copper in such one tonne sample. The calculation makes no provision for expected metal recoveries or smelter payables. USD per ounce commodity prices of
3. The Palladium Equivalent (“PdEq”) calculation expressed in g/t is calculated as the sum of the theoretical in situ value of the constituent metals (Au + Pt + Pd + Cu + Ag) in one tonne sampled divided by the value of one gram of palladium. The calculation makes no provision for expected metal recoveries or smelter payables. USD per ounce commodity prices of
Four Dams Prospect
Drilling at Four Dams was designed to test the down dip and eastern extension of the Four Dams Prospect, including a large untested Magnetotelluric target 400 metres east of the main Four Dams occurrence.
Drilling on the main Four Dams ultramafic pipe yielded mixed results. FD-24-046 encountered 74 metres of mineralized ultramafic rock grading 0.22% CuEq including 24 metres grading 0.30% CuEq as well as 2.0 metres of basal massive sulphides grading 0.65% CuEq. This mineralized sequence supports the exploration model targeting areas conducive to pooling of potentially high-grade massive sulphides at depth. FD-24-045 drilled approximately 85 metres to the east and FD-24-047 drilled approximately 100 metres to the west did not encounter similar ultramafic rocks and additional drilling will be required to adequately define the true extents of the ultramafic pipe both down dip and along strike. Follow up BHEM surveys will be conducted later in the summer to help define future targets.
Two drillholes completed on the eastern MT anomaly confirmed the MT response is related to mineralization. FD-24-044 targeted the upper portion of the anomaly and yielded 0.23% Cu over 22.0 metres, including 0.47% CuEq over 4.5 metres. FD-24-048 targeted the centre of the anomaly and yielded 0.45% CuEq over 18.0 metres including 0.86% CuEq over 2.0 metres. This under-explored zone represents a significant step out from the currently defined Four Dams prospect and warrants additional drilling to determine its true extent. Results from the Four Dams drilling campaign can be found in Table 4 below.
Table 3: 2024 Four Dams Drilling Location and Orientation
|
HoleID |
Total Depth |
CollarAzi |
Colar Dip |
Easting UTM NAD83 |
Northing UTM NAD83 |
Elevation |
|
FD-24-044 |
463 |
30 |
-65 |
548094 |
5408970 |
378 |
|
FD-24-045 |
510 |
31 |
-56 |
547797 |
5409165 |
376 |
|
FD-24-046 |
477 |
13 |
-52 |
547797 |
5409165 |
376 |
|
FD-24-047 |
483 |
27 |
-57 |
547659 |
5409204 |
375 |
|
FD-24-048 |
537 |
13 |
-73 |
548185 |
5408947 |
381 |
Table 4: 2024 Four Dams Drilling Results
|
HoleID |
From |
To |
Length1 |
Cu (%) |
Pd (g/t) |
Pt (g/t) |
Au (g/t) |
Ag (g/t) |
CuEq (%)2 |
|
FD-24-044 |
406 |
428 |
22 |
0.20 |
0.01 |
0.01 |
0.02 |
0.38 |
0.23 |
|
including |
422 |
426.5 |
4.5 |
0.42 |
0.01 |
0.02 |
0.03 |
0.39 |
0.47 |
|
FD-24-045 |
318 |
326 |
8 |
0.11 |
0.06 |
0.20 |
0.42 |
0.30 |
0.60 |
|
including |
320 |
322 |
2 |
0.25 |
0.14 |
0.43 |
0.91 |
0.80 |
1.32 |
|
FD-24-046 |
374 |
448 |
74 |
0.20 |
0.00 |
0.01 |
0.01 |
0.52 |
0.22 |
|
including |
392 |
416 |
24 |
0.29 |
0.00 |
0.01 |
0.00 |
0.81 |
0.30 |
|
and |
438 |
440 |
2 |
0.59 |
0.02 |
0.03 |
0.03 |
0.85 |
0.65 |
|
FD-24-047 |
356 |
368 |
12 |
0.12 |
0.10 |
0.06 |
0.07 |
0.58 |
0.28 |
|
FD-24-048 |
308 |
326 |
18 |
0.25 |
0.16 |
0.04 |
0.07 |
1.31 |
0.45 |
|
including |
324 |
326 |
2 |
0.55 |
0.17 |
0.02 |
0.18 |
2.70 |
0.86 |
1. All lengths are in metres. Interval lengths of interceptions are assumed to be approximate to true width.
2. The Copper Equivalent (“CuEq”) calculation expressed in % is calculated as the sum of the theoretical in situ value of the constituent metals (Au + Pt + Pd + Cu + Ag) in one tonne sampled divided by the value of one percent of copper in such one tonne sample. The calculation makes no provision for expected metal recoveries or smelter payables. USD per ounce commodity prices of
Biiwobik Prospect
A borehole electromagnetic survey was completed in two holes drilled over the winter at the Biiwobik Prospect.
The survey yielded three strong off hole conductors, two of which were targeted during Phase 2 of the 2024 Biiwobik drill program (see news release dated
Table 5: 2024 Biiwobik Drilling Location and Orientation
|
HoleID |
Total Depth |
CollarAzi |
Colar Dip |
Easting UTM NAD83 |
Northing UTM NAD83 |
Elevation |
|
MB-24-054 |
474 |
86 |
-70 |
549914 |
5406823 |
376 |
|
MB-24-055 |
459 |
90 |
-72 |
549934 |
5406765 |
370 |
|
MB-24-056 |
468 |
99 |
-70 |
549967 |
5406846 |
380 |
|
MB-24-057 |
459 |
93 |
-71 |
550013 |
5406611 |
369 |
|
MB-24-058 |
447 |
82 |
-68 |
549928 |
5406937 |
370 |
|
MB-24-059 |
426 |
82 |
-71 |
549940 |
5407002 |
356 |
|
MB-24-060 |
273 |
135 |
-71 |
550019 |
5407146 |
307 |
|
MB-24-061 |
441 |
88 |
-79 |
549979 |
5406708 |
368 |
Table 6: 2024 Biiwobik Drilling Results, including MB-24-054 to MB-24-059 (see news release dated
|
HoleID |
From |
To |
Length1 |
Cu (%) |
Pd (g/t) |
Pt (g/t) |
Au (g/t) |
Ag (g/t) |
CuEq (%)2 |
PdEq (g/t)3 |
|
MB-24-054 |
240 |
256 |
16 |
0.08 |
0.33 |
0.08 |
0.04 |
0.39 |
0.38 |
0.56 |
|
and |
262 |
296 |
34 |
0.11 |
1.02 |
0.17 |
0.08 |
0.29 |
0.96 |
1.41 |
|
including |
262 |
282 |
20 |
0.13 |
1.37 |
0.23 |
0.1 |
0.33 |
1.27 |
1.85 |
|
and |
374 |
385 |
11 |
0.39 |
0.5 |
0.09 |
0.04 |
2.25 |
0.84 |
1.22 |
|
and |
436 |
450 |
14 |
0.33 |
0.77 |
0.21 |
0.05 |
1.36 |
1.02 |
1.49 |
|
Including |
440 |
450 |
10 |
0.38 |
0.93 |
0.26 |
0.05 |
1.53 |
1.21 |
1.76 |
|
MB-24-055 |
172 |
198 |
26 |
0.07 |
0.16 |
0.08 |
0.04 |
0.4 |
0.26 |
0.38 |
|
and |
242 |
272 |
30 |
0.11 |
0.31 |
0.08 |
0.05 |
0.6 |
0.41 |
0.6 |
|
including |
242 |
262 |
20 |
0.04 |
0.42 |
0.1 |
0.05 |
0.26 |
0.42 |
0.62 |
|
and |
262 |
272 |
10 |
0.25 |
0.09 |
0.03 |
0.04 |
1.28 |
0.37 |
0.55 |
|
and |
378 |
384 |
6 |
0.15 |
0.26 |
0.1 |
0.06 |
0.6 |
0.43 |
0.64 |
|
and |
402 |
430 |
28 |
0.11 |
0.34 |
0.1 |
0.03 |
0.46 |
0.42 |
0.62 |
|
MB-24-056 |
168 |
174 |
6 |
0.12 |
0.5 |
0.14 |
0.08 |
0.5 |
0.6 |
0.88 |
|
and |
194 |
212 |
18 |
0.07 |
0.33 |
0.07 |
0.03 |
0.4 |
0.36 |
0.53 |
|
and |
422 |
428 |
6 |
0.19 |
0.39 |
0.12 |
0.05 |
1.87 |
0.58 |
0.85 |
|
MB-24-057 |
164 |
188 |
24 |
0.03 |
0.32 |
0.09 |
0.03 |
0.11 |
0.32 |
0.47 |
|
and |
362 |
378 |
16 |
0.3 |
0.68 |
0.15 |
0.07 |
1.97 |
0.92 |
1.35 |
|
MB-24-058 |
194 |
208 |
14 |
0.11 |
0.62 |
0.2 |
0.07 |
0.67 |
0.7 |
1.02 |
|
including |
198 |
208 |
10 |
0.13 |
0.77 |
0.23 |
0.08 |
0.76 |
0.85 |
1.24 |
|
and |
348 |
378 |
30 |
0.41 |
1.02 |
0.24 |
0.1 |
1.88 |
1.33 |
1.95 |
|
including |
364 |
372 |
8 |
0.85 |
2.48 |
0.57 |
0.22 |
4 |
3.06 |
4.47 |
|
and |
394 |
404 |
10 |
0.25 |
0.46 |
0.07 |
0.07 |
0.94 |
0.67 |
0.98 |
|
MB-24-059 |
216 |
250 |
34 |
0.05 |
0.4 |
0.14 |
0.08 |
0.19 |
0.46 |
0.68 |
|
including |
230 |
236 |
6 |
0.11 |
1.35 |
0.41 |
0.19 |
0.3 |
1.4 |
2.04 |
|
and |
324 |
346 |
22 |
0.19 |
0.9 |
0.19 |
0.08 |
0.89 |
0.98 |
1.43 |
|
including |
324 |
329 |
5 |
0.56 |
1.12 |
0.21 |
0.15 |
2.92 |
1.59 |
2.32 |
|
MB-24-060 |
240 |
256 |
16 |
0.08 |
0.33 |
0.08 |
0.04 |
0.39 |
0.38 |
0.56 |
|
MB-24-061 |
182 |
232 |
50 |
0.10 |
0.52 |
0.13 |
0.06 |
0.32 |
0.58 |
0.84 |
|
including |
214 |
224 |
10 |
0.23 |
1.50 |
0.26 |
0.13 |
0.80 |
1.50 |
2.20 |
|
and |
408 |
420 |
12 |
0.21 |
0.44 |
0.14 |
0.05 |
1.18 |
0.63 |
0.92 |
|
including |
408 |
414 |
6 |
0.35 |
0.69 |
0.22 |
0.08 |
1.90 |
1.02 |
1.49 |
1. All lengths are in metres. Interval lengths of interceptions are assumed to be approximate to true width.
2. The Copper Equivalent (“CuEq”) calculation expressed in % is calculated as the sum of the theoretical in situ value of the constituent metals (Au + Pt + Pd + Cu + Ag) in one tonne sampled divided by the value of one percent of copper in such one tonne sample. The calculation makes no provision for expected metal recoveries or smelter payables. USD per ounce commodity prices of
3. The Palladium Equivalent (“PdEq”) calculation expressed in g/t is calculated as the sum of the theoretical in situ value of the constituent metals (Au + Pt + Pd + Cu + Ag) in one tonne sampled divided by the value of one gram of palladium. The calculation makes no provision for expected metal recoveries or smelter payables. USD per ounce commodity prices of
Continuation of the 2024 Exploration Program
Field crews are currently on site carrying out surface stripping, field mapping and soil sampling programs over priority exploration targets, including multiple high priority Goldspot targets presented above. The company looks forward to presenting results from these programs as the progress advances over the summer field season.
Quality Assurance/Quality Control
Quality assurance and quality control protocols for the 2024 drilling assay program were unchanged from previous years and involve a rotating inclusion of one duplicate, blank, low-grade standard and high-grade standard every 15 samples. All controls are checked to be within a working limit of 2 standard deviations. Sample intervals are selected in 1m or 2m lengths dependent on the nature of the mineralized zone. The core samples are split on site using a diamond saw where half of the core is sent for analysis and the other half is securely stored on site for future reference. All samples are shipped to the ALS Global laboratory in
Data verification programs have included a review of QA/QC data, re-sampling and sample analysis programs, and database verification. Validation checks were performed on data, and comprise checks on surveys, collar coordinates and assay data.
About
Gen Mining’s focus is the development of the
The Feasibility Study estimated a Net Present Value (using a 6% discount rate) of
The Marathon Property covers a land package of approximately 22,000 hectares, or 220 square kilometres. Gen Mining owns a 100% interest in the
Qualified Person
The scientific and technical content of this news release was reviewed, verified, and approved by
Forward-Looking Information
This news release contains certain forward-looking information and forward-looking statements, as defined in applicable securities laws (collectively referred to herein as "forward-looking statements"). Forward-looking statements reflect current expectations or beliefs regarding future events or the Company’s future performance. All statements other than statements of historical fact are forward-looking statements. Often, but not always, forward-looking statements can be identified by the use of words such as "plans", "expects", "is expected", "budget", "scheduled", "estimates", "continues", "forecasts", "projects”, “predicts”, “intends”, “anticipates”, “targets” or “believes”, or variations of, or the negatives of, such words and phrases or state that certain actions, events or results “may”, “could”, “would”, “should”, “might” or “will” be taken, occur or be achieved, including statements relating to the ability of the current or future exploration programs to extend feeder zones, target higher grade mineralization, extend mine life, expand or alter potential mine pit designs; the possibility of future drilling adding to an inferred mineral resource or increasing potential metal grades in reserves or resources; and the anticipated life of mine; mineral production estimates, payback period, and financial returns from the
Although the Company believes that the expectations expressed in such statements are based on reasonable assumptions, such statements are not guarantees of future performance and actual results or developments may differ materially from those in the statements. There are certain factors that could cause actual results to differ materially from those in the forward-looking information. These include the timing for a construction decision; the progress of
development at the
Exploration results that include geophysics, sampling, and drill results on wide spacings may not be indicative of the occurrence of a mineral deposit. Such results do not provide assurance that further work will establish sufficient grade, continuity, metallurgical characteristics and economic potential to be classed as a category of mineral resource. Forward-looking statements are based on a number of assumptions which may prove to be incorrect, including, but not limited to, assumptions relating to: the availability of financing for the Company’s operations; operating and capital costs; results of operations; the mine development and production schedule and related costs; the supply and demand for, and the level and volatility of commodity prices; timing of the receipt of regulatory and governmental approvals for development projects and other operations; the accuracy of Mineral Reserve and Mineral Resource Estimates, production estimates and capital and operating cost estimates; and general business and economic conditions.
Investors are cautioned that any such statements are not guarantees of future performance and actual results or developments may differ materially from those projected in the forward-looking information. For more information on the Company, investors are encouraged to review the Company’s public filings on SEDAR+ at www.sedarplus.ca . The Company disclaims any intention or obligation to update or revise any forward- looking information, whether as a result of new information, future events or otherwise, other than as required by law.
View source version on businesswire.com: https://www.businesswire.com/news/home/20240726949339/en/
For further information please contact:
President and Chief Executive Officer
(416) 640-2934 (O)
(416) 567-2440 (M)
jlevy@genmining.com
Source:
